As you know by now, there’s only one thing that moves markets – liquidity. And liquidity generates profits on a monthly schedule…if you know where to look.
Here’s how it works:
- Central banks (in particular, the Fed) control liquidity.
- Liquidity controls the markets.
- Watch where central banks are sending the money, and you’ll be able to accurately predict the direction of the markets – up or down — every month.
It’s the “surest” money there is. And I’ve developed a simple indicator that shows you exactly how to get it.

You’re looking at a screencap of my proprietary indicator, LAMPP (Liquidity And Monetary Policy Profits). In a nutshell, this chart shows you where the Fed is sending its money over shorter and longer-term periods, and then generates a green “buy,” yellow “caution” or red “sell” signal based on that information.
I’ve made it even simpler for you with this traffic light graphic.
At the start of every month in Sure Money, you’ll receive three signals: one short-term, one intermediate, and one long-term. These signals come from my LAMPP system, and they’ll tell you when long, short, or hedging strategies will be appropriate.
Don’t worry – I’ll have specific recommendations for you, too. More on that below.
But first, let me take just a couple of minutes and explain what LAMPP is, and how and why it works.
How The Fed Controls The Markets – And How We Measure It
There’s only one way for the Fed’s monetary policy to be transmitted to the US economy. The official term is “open market operations.” That’s a fancy way of saying that the Fed buys bonds from securities dealers when it wants to stimulate growth.
The Fed hand picks a select group of privileged dealers to trade with. They are officially called Primary Dealers. Today there are 23 of them. They include most of the world’s largest banks. The Primary Dealers have accounts at the Fed, just like you and I have deposit accounts at our bank. When the Fed buys bonds from the dealers it pays for those bonds by crediting the dealer’s account in the amount of the purchase. This cash is instantly the dealer’s to do with as it sees fit. The dealers know what the Fed wants, but it’s the dealer’s money.
The Fed prints the money. The dealers decide what to do with it–how to deploy it.
The dealers are also known as market makers. Their business involves buying and selling all kinds of securities, not just bonds. They buy at one price with the goal of marking up the price a bit and selling at a profit. That’s what they have done all day every day for hundreds of years. Most of the time, they are very successful at that business.
They are, in essence, the owners of the markets, just like the big casino companies own Las Vegas. We are the players at the tables, the customers of the dealers.
You and I are small customers. Hedge funds and institutions are big customers. They are the whales. The dealers use all kinds of psychological tools to manipulate both the small customers like you and me, and the big whales. The goal is the same. It’s to mark up their securities inventories and sell them to us and their other customers at a profit.
When the Fed constantly injects money into this system by buying bonds from the dealers, two things happen. The dealers get cash, which they then use to purchase more securities (and derivatives). Or they can leverage the cash to borrow even more money and buy even more securities or derivatives. These include stocks, bonds, commodities, futures, and options.
Stocks may be their favorite kinds of inventory to buy and mark up, because that’s where there’s the greatest public participation is. It has the greatest potential for manipulating both the individual and institutional customers.
There are even TV networks devoted to helping the dealers market and move their inventories to the customers. These TV networks are like long running dealer infomercials. Dealer spokesmen appear with the network hosts to hawk their wares. The spokesmen recommend stocks for the investing public, their customers, to buy. The dealer’s trading desks sell the stocks to them from their own inventories adding their markup. The greater the public participation, the more the dealers can mark up their holdings.
The Fed stands behind these operations as both the dealers’ bank and their biggest customer. The Fed has been a given as a behemoth customer with an endless source of cash. It purchased a known quantity of securities month in and month out, going so far as to tell the dealers exactly how much it wanted to buy over what period. It even promised to buy the securities at the market, whatever it happened to be. Talk about a no-brainer.
Under QE, the Fed bought $4 trillion in securities from the dealers. The Fed credited the dealers with that amount cash into the dealers’ accounts. The dealers then used that cash to buy more securities, including most importantly for our purposes, stocks.
At the same time, the Primary Dealers are tasked with purchasing US Treasury debt securities from the US government. The Federal Government must constantly borrow hundreds of billions of dollars from the markets to fund the government’s regular outlays. The dealers are required to participate in the auctions of those securities. The dealers then get to trade that inventory with the public, selling and buying bonds and stocks, mostly with a nice markup.
What’s exciting is that these transactions translate directly into stock market motion.
The LAMPP Indicator Tracks The Fed, And Tells Us When The Markets Are Safe
Based on these facts, I’ve developed an indicator that tells us when it is safe to be in the market and when it isn’t. The ratio of Fed cash funding to the dealers relative to the amount of Treasury debt issue by the US Government tells us what we need to know.
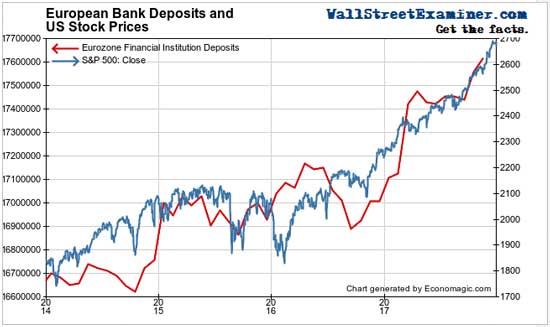
When rising, this ratio has been consistent with rising stock prices. When the ratio is rising, it has indicated that there’s cash left over after the dealers buy enough Treasuries to keep the Treasury market moving in the direction that the Fed wants it to. That leftover cash has funded the dealers’ stock accumulation, markup, and distribution operations.
That ratio has trended higher since the massive bailouts of 2008-09. As long as it has been rising, the dealers have been able to maintain a rising trend of stock prices as the accumulation-markup-distribution process is adequately funded.
The ratio of Fed cash to dealer injections relative to Treasury debt can also be used to trade intermediate stock market swings. An indicator that measures the spread between two short term moving averages of this ratio is useful for this purpose.
The LAMPP indicator is somewhat like the MACD indicator for stock prices. As long as the 3 week moving average of the ratio of Fed cash to Treasury debt is equal to or greater than 100% of the 13 week moving average, the trend of stock prices has been bullish. When the ratio drops below 100%, those have been good times to be out of the market. Or for those willing to play the short side, they have been good times to be short the market. As this bull market ages, we should expect more of those opportunities.
The Signal Is About to Change – And Here’s Why
Because the Fed is transparent in communicating policy in advance, we know that change is coming. Within a few months the Fed will stop buying securities and begin redeeming some of its holdings. Particularly important is that the Fed will allow some of the Treasury debt securities it holds to mature without purchasing new debt to replace it. That means the Treasury will literally need to pay back the Fed on those maturing holdings. Of course the Treasury doesn’t have the cash to make those repayments, so it will need to sell additional debt to the public to pay back the Fed and maintain outlays at their current levels.
Remember, the dealers are required to participate in those auctions. The Fed won’t be buying any securities from the dealers any more. The dealers will no longer have that constant source of ready cash. The dealers will have no choice but to lower their bids for the new Treasury debt, which would have the concomitant effect of causing yields to rise. The dealers will also no longer have extra cash available to play the stock accumulation-markup-distribution game that is their primary source of profits. From that point on, the dealers will be playing the short side of the market, looking to profit by marking stocks down rather than up. Thus begins the next bear market.
So the Fed has been providing an amount of cash each month that enables the dealers to buy their usual allotment of Treasury debt securities with something left over. As long as the Fed does that, the dealers have the wherewithal to engage in acquiring, marking up, and distributing stocks at a profit to themselves.
Lately the Fed has only been buying a trickle of what it used to buy between 2009 and 2014. Now it only buys enough paper from the dealers to replace a few mortgage backed securities that the Fed held but were paid off each month. It’s not a problem yet, but it will be when the Fed decides to stop doing that. And the problem will grow worse, much worse, when the Fed stops rolling over trillions of dollars’ worth of Treasury debt that it owns.
During the financial crisis, the Treasury issued enormous, unprecedented amounts of new debt to fund the bailout. You may remember that program as the TARP. At the same time, the Fed, inexplicably, cut the dealers off from funding. The Fed actually stopped buying securities from the dealers! The ratio of the Fed’s funding of the dealers relative to Treasury debt fell sharply. Dealers became unable to maintain orderly markets in stocks. Their ability to act as market makers became severely constrained. Stock prices collapsed as a result.
The Fed reversed course in early 2009 and began purchasing massive amounts of the newly issued Treasury debt and Federal Agency debt from dealers. The ratio of the Fed’s funding to dealers relative to all the new Treasury supply began to rise. The dealers began to resume their normal functions as market makers, buying and marking up stocks in early 2009. The trend of the ratio of Fed cash to dealers relative to Treasury debt has continued to rise with only brief exceptions for the past 8 years.
For long term investors, as long as the trend is rising, it’s safe to remain in the stock market. But once that trend ends, it will no longer be safe to do so.
The good news is, the LAMPP indicator will give the signal in plenty of time for you to take action to protect your capital, and it will also allow you to play along with the dealers on the short side to continue to profit and build wealth. You’ll get that indicator every month in Sure Money.
How We’ll Use The LAMPP Signal to Profit
Yogi Berra famously said, “In theory there’s no difference between theory and practice. In practice there is.” I have always loved that quote because I’m a practical guy. I want to know what works. If I know what works, it helps to know why it works, but the most important thing is that it works. The LAMPP works in practice, and we know why. That is where the theory comes in. The “in practice” is the most important thing. The practice part lies in how to use LAMPP tactically in our trading and investing.
Here’s how:
If the LAMPP is yellow, like it is now, it’s time to prepare for a change of major trend. More conservative long term investors should be psychologically prepared to sell their holdings when the long term LAMPP turns red. And it’s a good time to be scoping out, and even establishing pilot positions on the short side, in industries that are already in decline, or are technically overextended, such as consumer discretionary (XLK), or Broker Dealers (IAI) (which is thinly traded and should never be bought or sold in size). Another group that should come under pressure when the Fed starts shrinking its balance sheet would be financials (XLF).
For more active traders, when the signal goes from green to yellow, it is time to tighten stops. Also we’ll have a selection of more stocks to short, and potential puts to buy if red light triggers. When the red light triggers, we sell stocks, possibly buy gold or gold stocks, and buy puts or leap puts.
https://suremoneyinvestor.com/opportunity-reports/how-lampp-generates-profits-from-liquidity/


