Ultimately, all financial roads lead to Wall Street. The big investment banks and trading firms known as Primary Dealers all play in one worldwide money pool. When the ECB prints money, it’s not just available to Europe, it is also instantly available to Wall Street.
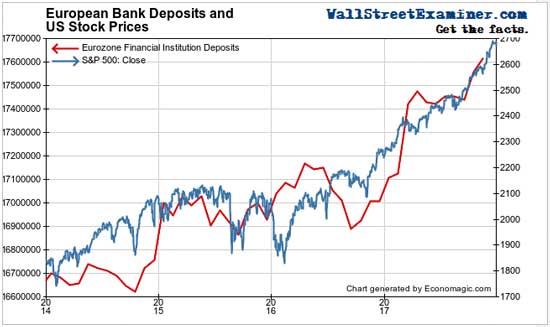
Growing European bank deposits have always strongly correlated with US Treasury note prices. However, that correlation has broken since mid 2016. Instead, European bank deposits have correlated strongly with US stock prices. That suggests that capital flows from Europe have been a key support to the US stock market rally.
European deposits have grown as the ECB has pumped trillions of Euros into their banking system. Deposit growth has not kept pace with the growth of the ECB’s balance sheet. This also suggests that money has been leaving the Continent and heading to Wall Street.
But that could all be about to change…
At the end of October the ECB announced that it would cut QE to €30 billion a month in January 2018. That’s a 50% cut. That’s money that will no longer be available to feed the US financial asset bubble.
This comes at the same time as the Fed is gradually ratcheting up its cuts to the size of its balance sheet to $20 billion per month in January, increasing to $50 billion in October. The Treasury will need to issue more supply to redeem the Fed’s holdings that it is cutting from its balance sheet.
Finally, the ECB cut will also coincide with the revenue reductions that will result from the Trump tax cuts. This will expand the deficit, and require the issuance of even more new Treasury supply.
With the ECB cutting its cash injections into the worldwide money pool by $30 billion per month on top of these other negative factors, this is a recipe for falling prices for both US bonds and stocks as 2018 progresses.
European Banks’ Love Affair with U.S. Stocks Is About to End
Total deposits surged in October and November. The annual growth rate is now 3.6%, most of which is due to the March TLTRO (Targeted Long Term Refinancing Operations). These operations pay the banks a reward for making loans. The TLTRO resulted in an increase of a whopping €293 billion (1.7%) in March.
The banks are no fools. There’s very little loan demand in Europe, so the banks engage in round robin lending operations to each other to qualify for the TLTRO bonus.
Even as the TLTROs are repaid, some of the deposits created when the ECB buys bonds outright stick around. Since the ECB started QE and NIRP at the end of 2014, it has managed to goose deposits in Europe’s banks by a total of 5.8%. Without the 2 TLTRO facilities, the growth rate would be close to zero. QE alone has had very negligible effect on the level of bank deposits. And the TLTROs are smoke and mirrors.

The total increase in deposits since the inception of NIRP/QE is now €967 billion. That is shocking considering that the ECB has pumped €2.5 trillion into the banks over that time. Most of it has disappeared. Depositors have used some of it to buy assets in the US and elsewhere. Much of the rest has gone toward paying down debt, thereby getting rid of the cost of holding deposits or European sovereign paper with negative yields.
Surging deposits in Europe have in the past been a bullish sign for US markets. The correlation is strongest with Treasuries as Europeans with cash tend to buy US Treasuries. But some of the deposits created when the ECB prints money are also used to buy stocks.
This year, the surge in deposits from the TLTRO had no significant impact on the US Treasury market. Instead, Europeans are apparently buying US stocks.


Since the inception of QE and NIRP in late 2014 there has been a strong correlation between the growth of European bank deposits and US stock prices. But this month the ECB will cut its asset purchases to $30 billion per month from $60 billion. This should cause deposit growth to radically slow because NIRP remains as a punitive measure for holding deposits. This should sharply cut the flow of European money into US equities.
So nothing has changed to cause me to alter my expectation of a bad year for US stocks in 2018. My technical work now says that the market is very close to a top. Markets don’t turn from bull to bear overnight. There’s no reason to expect a crash to be imminent. But over the course of this year, the risks will grow.
In September I began to recommend gradually and systematically building a large cash cushion through a series of regular small scale sales of stock with the goal of reaching 60-70% cash (more or less, depending on your personal circumstances), by the end of January. For those who only recently started selling, or have not started yet, I’d recommend reaching that level by the end of the first quarter.
The LAMPP Warns Traders to Be Cautious

The long term LAMPP remained green, but just barely, as the Federal Government slows debt issuance under the debt ceiling.
A big factor as I write was the expiration of $40 billion in Treasury Cash Management Bills. That put cash back into the accounts of the erstwhile holders of the paper, including banks and dealers. I would guess that this is at least part of the reason for the rally in stocks in the first 2 days of January. But this effect should be very short term.
The monthly settlement of Fed MBS purchases will decline over the next year. When the debt ceiling is finally lifted and the Treasury returns to the market at full speed, the LAMPP will turn red within weeks. The reduction of issuance will keep the indicator on green for the time being.
In January Fed draining operations will increase from $10 billion to $20 billion per month. This will drain cash from the banking system. That will rise quarterly to $50 billion per month in October.
$97 billion in Treasuries on the Fed’s balance sheet will mature in the first quarter. The Fed will tell the Treasury to repay $36 billion of that. That money will disappear from the banking system. It will reduce the amount of cash that feeds demand for securities.
If the Treasury resumes issuing new debt at the rate the TBAC has forecast in Q1, then the long term LAMPP should flash a red signal in roughly 4-5 weeks from the time the debt ceiling is lifted. However, as long as new Treasury issuance is restricted, the removal of supply from the marketplace will be a bullish factor for stocks.
The short term LAMPP edged back into yellow territory in mid December. Long side trades in the Wall Street Examiner Pro Trader model trading portfolio have done very well in recent weeks. Short side trading picks have been few.
In the meantime, I would not be buying long term positions. Short term trading from the long side should be watched closely for support breaks. Only when the Long Term LAMPP turns red, would I concentrate on trading from the short side. Prior to that, I would pick and choose shorts cautiously.
Sincerely,

Lee Adler
https://suremoneyinvestor.com/2018/01/the-tiny-little-straw-that-could-break-the-stock-markets-back-this-month/


